
抖音罗盘模拟生成器,电商数据罗盘模拟器,js前端代码实时
·
文件下载地址:http://www.lanzou.vip/i89ace213
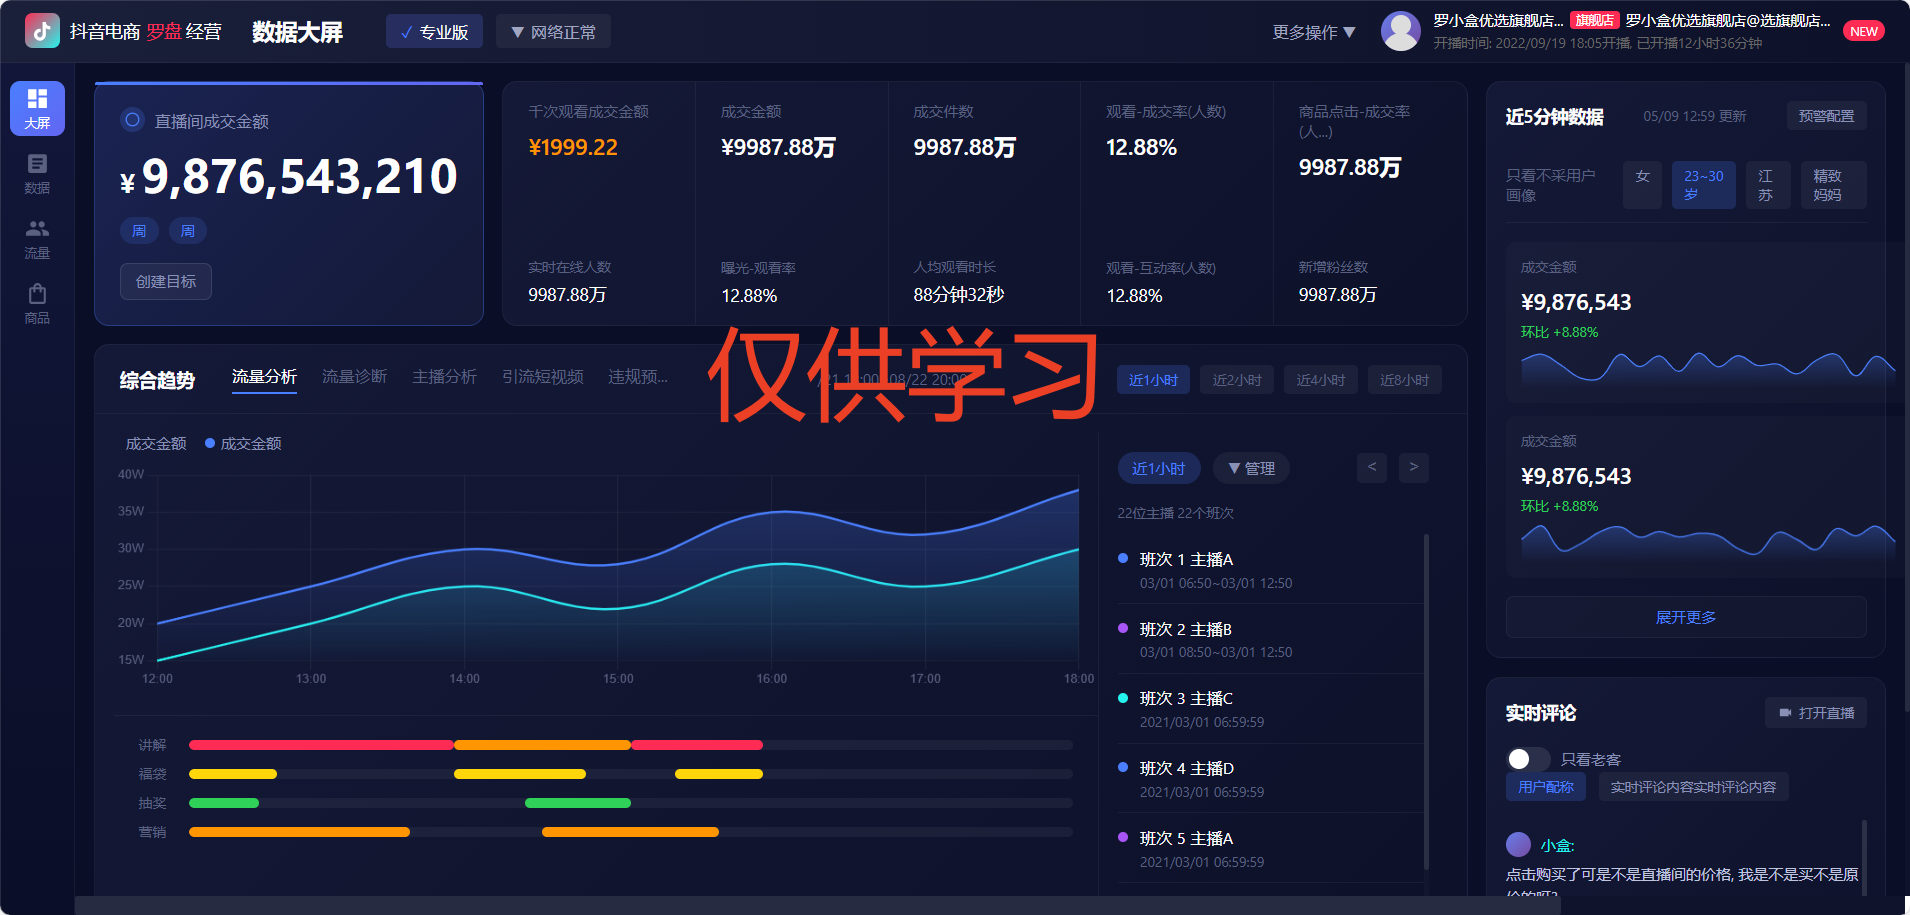
在电商运营领域,抖音罗盘已经成为商家分析经营数据的重要工具。然而,在实际开发过程中,我们常常需要在不依赖真实接口的情况下,模拟罗盘数据展示效果。今天,我将分享一个完整的抖音罗盘模拟生成器实现方案,使用纯JavaScript前端技术实现实时数据更新和可视化展示。
一、项目概述与核心功能
1.1 项目目标
-
模拟抖音电商罗盘数据可视化界面
-
实现实时数据更新和动画效果
-
提供可配置的数据模拟参数
-
响应式设计适配多端设备
1.2 技术栈
-
原生JavaScript (ES6+)
-
Canvas API 数据可视化
-
CSS3 动画与Flex布局
-
模块化设计模式
二、项目结构设计
<!-- 基础HTML结构 -->
<!DOCTYPE html>
<html lang="zh-CN">
<head>
    <meta charset="UTF-8">
    <meta name="viewport" content="width=device-width, initial-scale=1.0">
    <title>抖音电商罗盘模拟生成器</title>
    <link rel="stylesheet" href="style.css">
    <style>
        /* 基础样式将在后续部分详细说明 */
    </style>
</head>
<body>
    <div class="douyin-compass-container">
        <header class="compass-header">
            <h1>抖音电商罗盘模拟器</h1>
            <div class="control-panel">
                <button id="startSimulation">开始模拟</button>
                <button id="pauseSimulation">暂停</button>
                <button id="resetData">重置数据</button>
                <input type="range" id="updateSpeed" min="1" max="10" value="5">
                <span>更新速度: <span id="speedValue">5</span></span>
            </div>
        </header>

        <main class="compass-content">
            <div class="data-panel">
                <div class="real-time-metrics">
                    <!-- 实时指标展示区 -->
                </div>
                <div class="compass-visualization">
                    <canvas id="compassCanvas" width="600" height="600"></canvas>
                </div>
                <div class="data-controls">
                    <!-- 数据控制面板 -->
                </div>
            </div>

            <div class="history-chart">
                <canvas id="historyCanvas" width="800" height="300"></canvas>
            </div>
        </main>
    </div>

    <script src="compass-simulator.js"></script>
    <script src="data-visualizer.js"></script>
    <script src="main.js"></script>
</body>
</html>
三、核心JavaScript实现
3.1 数据模拟器类
// compass-simulator.js
class DouyinCompassSimulator {
    constructor() {
        this.metrics = {
            // 核心电商指标
            gmv: 100000,          // 总成交额
            orderCount: 500,      // 订单数
            uv: 10000,            // 访客数
            conversionRate: 5.2,  // 转化率
            avgPrice: 200,        // 客单价
            refundRate: 2.3,      // 退款率
            liveViewers: 5000,    // 直播间观看人数
            clickThroughRate: 3.5 // 点击率
        };

        this.historyData = [];
        this.updateInterval = null;
        this.updateSpeed = 2000; // 默认2秒更新一次
        this.isRunning = false;

        this.init();
    }

    init() {
        this.generateHistoryData();
        this.setupEventListeners();
    }

    // 生成历史数据
    generateHistoryData() {
        const hours = 24;
        const baseMetrics = { ...this.metrics };

        for (let i = 0; i < hours; i++) {
            const hourData = {};
            Object.keys(baseMetrics).forEach(key => {
                // 模拟自然波动
                const fluctuation = Math.random() * 0.2 - 0.1; // -10% 到 +10%
                hourData[key] = Math.round(baseMetrics[key] * (1 + fluctuation));
                hourData.timestamp = new Date(Date.now() - (hours - i) * 3600000);
            });
            this.historyData.push(hourData);
        }
    }

    // 模拟实时数据更新
    simulateRealTimeUpdate() {
        Object.keys(this.metrics).forEach(key => {
            // 根据不同指标特性设置不同的波动范围
            const fluctuationRanges = {
                gmv: 0.15,
                orderCount: 0.25,
                uv: 0.1,
                conversionRate: 0.08,
                avgPrice: 0.05,
                refundRate: 0.1,
                liveViewers: 0.3,
                clickThroughRate: 0.12
            };

            const range = fluctuationRanges[key] || 0.1;
            const fluctuation = Math.random() * range * 2 - range;
            const change = this.metrics[key] * fluctuation;

            // 确保数据合理范围
            if (key === 'conversionRate' || key === 'refundRate' || key === 'clickThroughRate') {
                this.metrics[key] = Math.max(0, Math.min(100,
                    this.metrics[key] + change));
            } else {
                this.metrics[key] = Math.max(0, this.metrics[key] + change);
            }

            this.metrics[key] = Math.round(this.metrics[key] * 100) / 100;
        });

        // 添加最新数据到历史记录
        const newHistoryPoint = {
            ...this.metrics,
            timestamp: new Date()
        };
        this.historyData.push(newHistoryPoint);
        if (this.historyData.length > 100) {
            this.historyData.shift();
        }

        this.dispatchUpdateEvent();
    }

    // 自定义事件通知数据更新
    dispatchUpdateEvent() {
        const event = new CustomEvent('compassDataUpdate', {
            detail: {
                metrics: this.metrics,
                history: this.historyData.slice(-24) // 最近24条数据
            }
        });
        window.dispatchEvent(event);
    }

    // 控制模拟器
    startSimulation() {
        if (this.isRunning) return;

        this.isRunning = true;
        this.updateInterval = setInterval(() => {
            this.simulateRealTimeUpdate();
        }, this.updateSpeed);
    }

    pauseSimulation() {
        this.isRunning = false;
        if (this.updateInterval) {
            clearInterval(this.updateInterval);
            this.updateInterval = null;
        }
    }

    resetData() {
        this.pauseSimulation();
        // 重置为初始值
        this.metrics = {
            gmv: 100000,
            orderCount: 500,
            uv: 10000,
            conversionRate: 5.2,
            avgPrice: 200,
            refundRate: 2.3,
            liveViewers: 5000,
            clickThroughRate: 3.5
        };
        this.dispatchUpdateEvent();
    }

    setUpdateSpeed(speed) {
        this.updateSpeed = 3000 - (speed * 250); // 速度值映射到时间间隔
        if (this.isRunning) {
            this.pauseSimulation();
            this.startSimulation();
        }
    }

    setupEventListeners() {
        // 将在主文件中绑定
    }
}
3.2 数据可视化类
javascript
// data-visualizer.js
class CompassVisualizer {
    constructor(canvasId) {
        this.canvas = document.getElementById(canvasId);
        this.ctx = this.canvas.getContext('2d');
        this.metrics = {};
        this.animationFrame = null;

        this.colors = {
            primary: '#FF2C9C',    // 抖音粉
            secondary: '#00C2FF',  // 抖音蓝
            success: '#00D8A0',
            warning: '#FF9F00',
            danger: '#FF4D4D',
            background: '#1A1A1A'
        };

        this.initCanvas();
    }

    initCanvas() {
        // 适配高清屏幕
        const dpr = window.devicePixelRatio || 1;
        const rect = this.canvas.getBoundingClientRect();

        this.canvas.width = rect.width * dpr;
        this.canvas.height = rect.height * dpr;

        this.ctx.scale(dpr, dpr);
        this.ctx.translate(rect.width / 2, rect.height / 2);
    }

    drawCompass(metrics) {
        this.metrics = metrics;

        // 清除画布
        this.ctx.clearRect(
            -this.canvas.width / 2,
            -this.canvas.height / 2,
            this.canvas.width,
            this.canvas.height
        );

        this.drawBackground();
        this.drawRings();
        this.drawDataPoints();
        this.drawLabels();
        this.drawCenterInfo();
    }

    drawBackground() {
        // 绘制深色背景
        this.ctx.fillStyle = this.colors.background;
        this.ctx.fillRect(
            -this.canvas.width / 2,
            -this.canvas.height / 2,
            this.canvas.width,
            this.canvas.height
        );

        // 绘制网格
        this.ctx.strokeStyle = 'rgba(255,255,255,0.1)';
        this.ctx.lineWidth = 1;

        // 同心圆网格
        for (let i = 1; i <= 5; i++) {
            const radius = i * 60;
            this.ctx.beginPath();
            this.ctx.arc(0, 0, radius, 0, Math.PI * 2);
            this.ctx.stroke();
        }

        // 径向线
        for (let i = 0; i < 8; i++) {
            const angle = (i * Math.PI) / 4;
            this.ctx.beginPath();
            this.ctx.moveTo(0, 0);
            this.ctx.lineTo(
                Math.cos(angle) * 300,
                Math.sin(angle) * 300
            );
            this.ctx.stroke();
        }
    }

    drawRings() {
        const metrics = Object.values(this.metrics);
        const maxValue = Math.max(...metrics);
        const ringCount = 5;

        for (let i = 0; i < ringCount; i++) {
            const radius = (i + 1) * 60;
            const gradient = this.ctx.createRadialGradient(
                0, 0, radius - 10,
                0, 0, radius
            );

            gradient.addColorStop(0, 'rgba(255,44,156,0.1)');
            gradient.addColorStop(1, 'rgba(255,44,156,0.3)');

            this.ctx.beginPath();
            this.ctx.arc(0, 0, radius, 0, Math.PI * 2);
            this.ctx.strokeStyle = gradient;
            this.ctx.lineWidth = 2;
            this.ctx.stroke();
        }
    }

    drawDataPoints() {
        const metricKeys = Object.keys(this.metrics);
        const angleStep = (Math.PI * 2) / metricKeys.length;

        metricKeys.forEach((key, index) => {
            const angle = index * angleStep;
            const value = this.metrics[key];
            const maxValue = Math.max(...Object.values(this.metrics));
            const radius = (value / maxValue) * 240 + 40;

            const x = Math.cos(angle) * radius;
            const y = Math.sin(angle) * radius;

            // 绘制数据点
            this.ctx.beginPath();
            this.ctx.arc(x, y, 8, 0, Math.PI * 2);
            this.ctx.fillStyle = this.getMetricColor(key);
            this.ctx.fill();

            // 绘制连接线
            this.ctx.beginPath();
            this.ctx.moveTo(0, 0);
            this.ctx.lineTo(x, y);
            this.ctx.strokeStyle = this.getMetricColor(key) + '80';
            this.ctx.lineWidth = 2;
            this.ctx.stroke();

            // 绘制数据区域
            const nextIndex = (index + 1) % metricKeys.length;
            const nextKey = metricKeys[nextIndex];
            const nextValue = this.metrics[nextKey];
            const nextRadius = (nextValue / maxValue) * 240 + 40;
            const nextAngle = nextIndex * angleStep;
            const nextX = Math.cos(nextAngle) * nextRadius;
            const nextY = Math.sin(nextAngle) * nextRadius;

            this.ctx.beginPath();
            this.ctx.moveTo(x, y);
            this.ctx.lineTo(nextX, nextY);
            this.ctx.lineTo(
                Math.cos(nextAngle) * 40,
                Math.sin(nextAngle) * 40
            );
            this.ctx.lineTo(
                Math.cos(angle) * 40,
                Math.sin(angle) * 40
            );
            this.ctx.closePath();

            const areaGradient = this.ctx.createLinearGradient(0, 0, x, y);
            areaGradient.addColorStop(0, this.getMetricColor(key) + '40');
            areaGradient.addColorStop(1, this.getMetricColor(nextKey) + '40');

            this.ctx.fillStyle = areaGradient;
            this.ctx.fill();
        });
    }

    drawLabels() {
        const metricKeys = Object.keys(this.metrics);
        const metricNames = {
            gmv: '成交额',
            orderCount: '订单数',
            uv: '访客数',
            conversionRate: '转化率',
            avgPrice: '客单价',
            refundRate: '退款率',
            liveViewers: '直播间人数',
            clickThroughRate: '点击率'
        };

        const angleStep = (Math.PI * 2) / metricKeys.length;

        metricKeys.forEach((key, index) => {
            const angle = index * angleStep;
            const radius = 280;

            const x = Math.cos(angle) * radius;
            const y = Math.sin(angle) * radius;

            this.ctx.save();
            this.ctx.translate(x, y);
            this.ctx.rotate(angle + Math.PI / 2);

            this.ctx.fillStyle = '#FFFFFF';
            this.ctx.font = '14px "Microsoft YaHei", sans-serif';
            this.ctx.textAlign = 'center';
            this.ctx.fillText(metricNames[key], 0, 0);

            this.ctx.fillStyle = this.getMetricColor(key);
            this.ctx.font = 'bold 16px "Microsoft YaHei", sans-serif';
            this.ctx.fillText(this.metrics[key], 0, 20);

            this.ctx.restore();
        });
    }

    drawCenterInfo() {
        // 绘制中心信息
        this.ctx.beginPath();
        this.ctx.arc(0, 0, 35, 0, Math.PI * 2);
        this.ctx.fillStyle = 'rgba(255,255,255,0.1)';
        this.ctx.fill();

        this.ctx.fillStyle = '#FFFFFF';
        this.ctx.font = 'bold 14px "Microsoft YaHei", sans-serif';
        this.ctx.textAlign = 'center';
        this.ctx.fillText('实时概览', 0, -8);

        const totalOrders = this.metrics.orderCount || 0;
        this.ctx.font = 'bold 18px "Microsoft YaHei", sans-serif';
        this.ctx.fillStyle = this.colors.primary;
        this.ctx.fillText(totalOrders.toString(), 0, 15);
    }

    getMetricColor(metricKey) {
        const colorMap = {
            gmv: this.colors.primary,
            orderCount: this.colors.secondary,
            uv: this.colors.success,
            conversionRate: '#00D8A0',
            avgPrice: '#9D4CFF',
            refundRate: this.colors.danger,
            liveViewers: '#FF9F00',
            clickThroughRate: '#00C2FF'
        };

        return colorMap[metricKey] || this.colors.primary;
    }

    updateMetrics(newMetrics) {
        this.metrics = newMetrics;
        this.drawCompass(this.metrics);
    }

    startAnimation() {
        const animate = () => {
            this.drawCompass(this.metrics);
            this.animationFrame = requestAnimationFrame(animate);
        };
        animate();
    }

    stopAnimation() {
        if (this.animationFrame) {
            cancelAnimationFrame(this.animationFrame);
        }
    }
}
3.3 历史图表绘制器
javascript
// history-chart.js
class HistoryChart {
    constructor(canvasId) {
        this.canvas = document.getElementById(canvasId);
        this.ctx = this.canvas.getContext('2d');
        this.historyData = [];

        this.initCanvas();
    }

    initCanvas() {
        const dpr = window.devicePixelRatio || 1;
        const rect = this.canvas.getBoundingClientRect();

        this.canvas.width = rect.width * dpr;
        this.canvas.height = rect.height * dpr;
        this.ctx.scale(dpr, dpr);
    }

    drawChart(data, metricType = 'gmv') {
        if (!data || data.length === 0) return;

        const ctx = this.ctx;
        const width = this.canvas.width / (window.devicePixelRatio || 1);
        const height = this.canvas.height / (window.devicePixelRatio || 1);

        // 清除画布
        ctx.clearRect(0, 0, width, height);

        // 绘制背景
        ctx.fillStyle = '#1A1A1A';
        ctx.fillRect(0, 0, width, height);

        // 计算数据范围
        const values = data.map(item => item[metricType]);
        const maxValue = Math.max(...values);
        const minValue = Math.min(...values);
        const valueRange = maxValue - minValue;

        // 绘制网格
        ctx.strokeStyle = 'rgba(255,255,255,0.1)';
        ctx.lineWidth = 1;

        // 水平网格线
        const gridLines = 5;
        for (let i = 0; i <= gridLines; i++) {
            const y = (height - 40) * (i / gridLines) + 20;
            ctx.beginPath();
            ctx.moveTo(40, y);
            ctx.lineTo(width - 20, y);
            ctx.stroke();

            // 刻度值
            ctx.fillStyle = 'rgba(255,255,255,0.6)';
            ctx.font = '12px Arial';
            ctx.textAlign = 'right';
            ctx.fillText(
                Math.round(maxValue - (valueRange * i / gridLines)).toString(),
                35, y + 4
            );
        }

        // 绘制数据线
        const pointCount = data.length;
        const step = (width - 60) / (pointCount - 1);

        ctx.beginPath();
        ctx.strokeStyle = '#FF2C9C';
        ctx.lineWidth = 3;
        ctx.lineJoin = 'round';

        data.forEach((item, index) => {
            const x = 40 + index * step;
            const yValue = item[metricType];
            const y = 20 + (height - 40) * (1 - (yValue - minValue) / valueRange);

            if (index === 0) {
                ctx.moveTo(x, y);
            } else {
                ctx.lineTo(x, y);
            }

            // 绘制数据点
            ctx.beginPath();
            ctx.arc(x, y, 4, 0, Math.PI * 2);
            ctx.fillStyle = '#FF2C9C';
            ctx.fill();
        });

        ctx.stroke();

        // 绘制时间标签
        const timeLabels = this.generateTimeLabels(data);
        timeLabels.forEach((label, index) => {
            if (index % Math.ceil(pointCount / 8) === 0) {
                const x = 40 + index * step;
                ctx.fillStyle = 'rgba(255,255,255,0.6)';
                ctx.font = '12px Arial';
                ctx.textAlign = 'center';
                ctx.fillText(label, x, height - 5);
            }
        });

        // 绘制标题
        const metricNames = {
            gmv: '成交额趋势',
            orderCount: '订单数趋势',
            uv: '访客数趋势',
            conversionRate: '转化率趋势'
        };

        ctx.fillStyle = '#FFFFFF';
        ctx.font = 'bold 16px "Microsoft YaHei", sans-serif';
        ctx.textAlign = 'left';
        ctx.fillText(metricNames[metricType] || '数据趋势', 20, 15);
    }

    generateTimeLabels(data) {
        return data.map(item => {
            const date = new Date(item.timestamp);
            return `${date.getHours()}:00`;
        });
    }

    updateData(newData) {
        this.historyData = newData;
        this.drawChart(newData, 'gmv');
    }
}
3.4 主控制文件
javascript
// main.js
document.addEventListener('DOMContentLoaded', () => {
    // 初始化模拟器
    const simulator = new DouyinCompassSimulator();

    // 初始化可视化组件
    const compassVisualizer = new CompassVisualizer('compassCanvas');
    const historyChart = new HistoryChart('historyCanvas');

    // 初始化实时指标显示
    const metricDisplays = {
        gmv: document.getElementById('gmvValue'),
        orderCount: document.getElementById('orderCountValue'),
        uv: document.getElementById('uvValue'),
        conversionRate: document.getElementById('conversionRateValue')
    };

    // 事件监听:数据更新
    window.addEventListener('compassDataUpdate', (event) => {
        const { metrics, history } = event.detail;

        // 更新罗盘可视化
        compassVisualizer.updateMetrics(metrics);

        // 更新历史图表
        historyChart.updateData(history);

        // 更新实时指标显示
        updateMetricDisplays(metrics);
    });

    // 更新指标显示函数
    function updateMetricDisplays(metrics) {
        Object.keys(metricDisplays).forEach(key => {
            if (metricDisplays[key]) {
                let value = metrics[key];

                // 格式化显示
                if (key === 'gmv') {
                    value = formatCurrency(value);
                } else if (key.includes('Rate')) {
                    value = value.toFixed(2) + '%';
                } else {
                    value = formatNumber(value);
                }

                metricDisplays[key].textContent = value;

                // 添加动画效果
                metricDisplays[key].classList.add('value-updated');
                setTimeout(() => {
                    metricDisplays[key].classList.remove('value-updated');
                }, 500);
            }
        });
    }

    // 数字格式化函数
    function formatNumber(num) {
        if (num >= 10000) {
            return (num / 10000).toFixed(1) + '万';
        }
        return num.toLocaleString();
    }

    function formatCurrency(num) {
        if (num >= 10000) {
            return '¥' + (num / 10000).toFixed(1) + '万';
        }
        return '¥' + num.toLocaleString();
    }

    // 控制面板事件绑定
    document.getElementById('startSimulation').addEventListener('click', () => {
        simulator.startSimulation();
        compassVisualizer.startAnimation();
    });

    document.getElementById('pauseSimulation').addEventListener('click', () => {
        simulator.pauseSimulation();
        compassVisualizer.stopAnimation();
    });

    document.getElementById('resetData').addEventListener('click', () => {
        simulator.resetData();
    });

    document.getElementById('updateSpeed').addEventListener('input', (e) => {
        const speed = parseInt(e.target.value);
        document.getElementById('speedValue').textContent = speed;
        simulator.setUpdateSpeed(speed);
    });

    // 响应窗口大小变化
    window.addEventListener('resize', () => {
        compassVisualizer.initCanvas();
        historyChart.initCanvas();
        compassVisualizer.drawCompass(simulator.metrics);
        historyChart.drawChart(simulator.historyData.slice(-24));
    });

    // 初始绘制
    compassVisualizer.drawCompass(simulator.metrics);
    historyChart.drawChart(simulator.historyData.slice(-24));
    updateMetricDisplays(simulator.metrics);
});
四、CSS样式设计
css
/* style.css */
* {
    margin: 0;
    padding: 0;
    box-sizing: border-box;
}

body {
    font-family: 'Microsoft YaHei', 'Segoe UI', Arial, sans-serif;
    background: linear-gradient(135deg, #1a1a2e 0%, #16213e 100%);
    color: #fff;
    min-height: 100vh;
    padding: 20px;
}

.douyin-compass-container {
    max-width: 1400px;
    margin: 0 auto;
    padding: 20px;
}

.compass-header {
    text-align: center;
    margin-bottom: 30px;
    padding: 20px;
    background: rgba(255, 255, 255, 0.05);
    border-radius: 15px;
    backdrop-filter: blur(10px);
    border: 1px solid rgba(255, 255, 255, 0.1);
}

.compass-header h1 {
    font-size: 2.5rem;
    margin-bottom: 20px;
    background: linear-gradient(45deg, #FF2C9C, #00C2FF);
    -webkit-background-clip: text;
    -webkit-text-fill-color: transparent;
    text-shadow: 0 2px 10px rgba(255, 44, 156, 0.3);
}

.control-panel {
    display: flex;
    justify-content: center;
    align-items: center;
    gap: 20px;
    flex-wrap: wrap;
}

.control-panel button {
    padding: 12px 24px;
    border: none;
    border-radius: 25px;
    background: linear-gradient(45deg, #FF2C9C, #FF6B9D);
    color: white;
    font-weight: bold;
    cursor: pointer;
    transition: all 0.3s ease;
    box-shadow: 0 4px 15px rgba(255, 44, 156, 0.3);
}

.control-panel button:hover {
    transform: translateY(-2px);
    box-shadow: 0 6px 20px rgba(255, 44, 156, 0.4);
}

.control-panel button:active {
    transform: translateY(0);
}

#pauseSimulation {
    background: linear-gradient(45deg, #6c757d, #adb5bd);
}

#resetData {
    background: linear-gradient(45deg, #FF4D4D, #FF6B6B);
}

.control-panel input[type="range"] {
    width: 200px;
    height: 10px;
    -webkit-appearance: none;
    background: linear-gradient(90deg, #FF2C9C, #00C2FF);
    border-radius: 5px;
    outline: none;
}

.control-panel input[type="range"]::-webkit-slider-thumb {
    -webkit-appearance: none;
    width: 24px;
    height: 24px;
    border-radius: 50%;
    background: white;
    cursor: pointer;
    box-shadow: 0 2px 10px rgba(0, 0, 0, 0.3);
}

.compass-content {
    display: grid;
    grid-template-columns: 1fr 1fr;
    gap: 30px;
    margin-bottom: 30px;
}

@media (max-width: 1200px) {
    .compass-content {
        grid-template-columns: 1fr;
    }
}

.data-panel {
    background: rgba(255, 255, 255, 0.05);
    border-radius: 20px;
    padding: 30px;
    backdrop-filter: blur(10px);
    border: 1px solid rgba(255, 255, 255, 0.1);
}

.real-time-metrics {
    display: grid;
    grid-template-columns: repeat(2, 1fr);
    gap: 20px;
    margin-bottom: 30px;
}

.metric-card {
    background: rgba(255, 255, 255, 0.08);
    border-radius: 15px;
    padding: 20px;
    transition: all 0.3s ease;
    border: 1px solid transparent;
}

.metric-card:hover {
    border-color: rgba(255, 44, 156, 0.3);
    transform: translateY(-5px);
}

.metric-card h3 {
    font-size: 1rem;
    color: rgba(255, 255, 255, 0.7);
    margin-bottom: 10px;
}

.metric-value {
    font-size: 2.5rem;
    font-weight: bold;
    background: linear-gradient(45deg, #FF2C9C, #00C2FF);
    -webkit-background-clip: text;
    -webkit-text-fill-color: transparent;
    transition: all 0.3s ease;
}

.metric-value.value-updated {
    animation: pulse 0.5s ease;
}

@keyframes pulse {
    0% { transform: scale(1); }
    50% { transform: scale(1.1); }
    100% { transform: scale(1); }
}

.compass-visualization {
    display: flex;
    justify-content: center;
    margin: 30px 0;
}

#compassCanvas {
    max-width: 100%;
    height: auto;
    border-radius: 15px;
    box-shadow: 0 10px 30px rgba(0, 0, 0, 0.3);
}

.data-controls {
    display: flex;
    justify-content: center;
    gap: 15px;
    flex-wrap: wrap;
}

.control-btn {
    padding: 10px 20px;
    border: none;
    border-radius: 20px;
    background: rgba(255, 255, 255, 0.1);
    color: white;
    cursor: pointer;
    transition: all 0.3s ease;
    font-size: 0.9rem;
}

.control-btn:hover {
    background: rgba(255, 44, 156, 0.2);
    transform: translateY(-2px);
}

.control-btn.active {
    background: linear-gradient(45deg, #FF2C9C, #FF6B9D);
    box-shadow: 0 4px 15px rgba(255, 44, 156, 0.3);
}

.history-chart {
    background: rgba(255, 255, 255, 0.05);
    border-radius: 20px;
    padding: 30px;
    backdrop-filter: blur(10px);
    border: 1px solid rgba(255, 255, 255, 0.1);
}

#historyCanvas {
    width: 100%;
    height: 300px;
    border-radius: 10px;
}

/* 响应式设计 */
@media (max-width: 768px) {
    .compass-header h1 {
        font-size: 1.8rem;
    }

    .control-panel {
        flex-direction: column;
        align-items: stretch;
    }

    .control-panel button {
        width: 100%;
    }

    .real-time-metrics {
        grid-template-columns: 1fr;
    }

    .compass-content {
        padding: 10px;
    }

    .data-panel, .history-chart {
        padding: 20px;
    }
}

/* 暗色模式适配 */
@media (prefers-color-scheme: dark) {
    body {
        background: linear-gradient(135deg, #0d1117 0%, #161b22 100%);
    }

    .metric-card {
        background: rgba(255, 255, 255, 0.05);
    }
}

/* 打印样式 */
@media print {
    .control-panel {
        display: none;
    }

    body {
        background: white;
        color: black;
    }

    .douyin-compass-container {
        box-shadow: none;
    }
}
五、使用说明与配置
5.1 快速启动
javascript
// 最简单的启动方式
const simulator = new DouyinCompassSimulator();
simulator.startSimulation();

// 或者使用配置选项
const config = {
    initialGMV: 500000,
    updateInterval: 3000,
    metrics: ['gmv', 'uv', 'conversionRate']
};
5.2 自定义指标
javascript
// 添加自定义指标
simulator.metrics.customMetric = 1000;
simulator.dispatchUpdateEvent();

// 修改指标颜色
compassVisualizer.colors.customMetric = '#FF9900';
5.3 数据导出
javascript
// 导出当前数据
function exportData() {
    const data = {
        metrics: simulator.metrics,
        history: simulator.historyData,
        timestamp: new Date().toISOString()
    };

    const blob = new Blob([JSON.stringify(data, null, 2)], {
        type: 'application/json'
    });

    const url = URL.createObjectURL(blob);
    const a = document.createElement('a');
    a.href = url;
    a.download = `douyin-compass-data-${new Date().getTime()}.json`;
    a.click();
}
六、性能优化建议
6.1 Canvas渲染优化
javascript
// 使用离屏Canvas预渲染
class OptimizedVisualizer extends CompassVisualizer {
    constructor(canvasId) {
        super(canvasId);
        this.offscreenCanvas = document.createElement('canvas');
        this.offscreenCtx = this.offscreenCanvas.getContext('2d');
    }

    drawCompass(metrics) {
        // 在离屏Canvas上绘制
        this.offscreenCanvas.width = this.canvas.width;
        this.offscreenCanvas.height = this.canvas.height;

        // ... 绘制逻辑

        // 复制到主Canvas
        this.ctx.drawImage(this.offscreenCanvas, 0, 0);
    }
}
6.2 数据更新优化
javascript
// 节流数据更新
function throttle(func, limit) {
    let inThrottle;
    return function() {
        const args = arguments;
        const context = this;
        if (!inThrottle) {
            func.apply(context, args);
            inThrottle = true;
            setTimeout(() => inThrottle = false, limit);
        }
    }
}

// 使用
window.addEventListener('compassDataUpdate', throttle(updateUI, 16));
七、总结与展望
本文详细介绍了抖音电商罗盘模拟生成器的完整实现方案。通过这个项目,我们实现了:
-
实时数据模拟:模拟抖音电商数据的动态变化
-
可视化展示:使用Canvas实现专业的罗盘图表
-
交互控制:提供完整的控制面板和数据操作
-
响应式设计:适配不同尺寸的屏幕设备

电商企业物流数字化转型必备!快递鸟 API 接口,72 小时快速完成物流系统集成。全流程实战1V1指导,营造开放的API技术生态圈。
更多推荐


 29
29 0
0- 0


 已为社区贡献1条内容

所有评论(0)