
Rust 性能提升“最后一公里”:详解 Profiling 瓶颈定位与优化|得物技术
然而,在这次大规模迁移中,我们观察到一个有趣的现象:大多数服务在迁移后性能都得到了显著提升,但有那么一小部分服务,性能提升却不尽如人意,仅仅在 10% 左右徘徊。原来,我们的代码在每次写入 OSS 时,都会新建一个 OSS 实例,随之而来的是一个全新的 HTTP 客户端和一次耗时的 TLS 握手。即使在已经实现了初步性能提升的 Rust 服务中,仍然存在巨大的优化空间。未来,我们将继续探索更高效的
一、Profiling:揭示性能瓶颈的“照妖镜”
在过去的一年里,我们团队完成了一项壮举:将近万核的 Java 服务成功迁移到 Rust,并收获了令人瞩目的性能提升。我们的实践经验已在《RUST练习生如何在生产环境构建万亿流量》一文中与大家分享。然而,在这次大规模迁移中,我们观察到一个有趣的现象:大多数服务在迁移后性能都得到了显著提升,但有那么一小部分服务,性能提升却不尽如人意,仅仅在 10% 左右徘徊。
这让我们感到疑惑。明明已经用上了性能“王者”Rust,为什么还会遇到瓶颈?为了解开这个谜团,我们决定深入剖析这些“低提升”服务。今天,我就来和大家分享,我们是如何利用 Profiling 工具,找到并解决写入过程中的性能瓶颈,最终实现更高性能飞跃的!
在性能优化领域,盲目猜测是最大的禁忌。你需要一把锋利的“手术刀”,精准地找到问题的根源。在 Rust 生态中,虽然不像 Java 社区那样拥有 VisualVM 或 JProfiler 这类功能强大的成熟工具,但我们依然可以搭建一套高效的性能分析体系。
为了在生产环境中实现高效的性能监控,我们引入了 Jemalloc 内存分配器和 pprof CPU 分析器。这套方案不仅支持定时自动生成 Profile 文件,还可以在运行时动态触发,极大地提升了我们定位问题的能力。
二、配置项目:让Profiling“武装到牙齿”
首先,我们需要在 Cargo.toml 文件中添加必要的依赖,让我们的 Rust 服务具备 Profiling 的能力。以下是我们的配置,Rust 版本为 1.87.0。
[target.'cfg(all(not(target_env = "msvc"), not(target_os = "windows")))'.dependencies] # 使用 tikv-jemallocator 作为内存分配器,并启用性能分析功能 tikv-jemallocator = { version = "0.6", features = ["profiling", "unprefixed_malloc_on_supported_platforms"] } # 用于在运行时控制和获取 jemalloc 的统计信息 tikv-jemalloc-ctl = { version = "0.6", features = ["use_std", "stats"] } # tikv-jemallocator 的底层绑定,同样启用性能分析 tikv-jemalloc-sys = { version = "0.6", features = ["profiling"] } # 用于生成与 pprof 兼容的内存剖析数据,并支持符号化和火焰图 jemalloc_pprof = { version = "0.7", features = ["symbolize","flamegraph"] } # 用于生成 CPU 性能剖析数据和火焰图 pprof = { version = "0.14", features = ["flamegraph", "protobuf-codec"] }
简单来说,这几个依赖各司其职:
※ tikv-jemallocator
基于 jemalloc 的 Rust 实现,以其高效的内存管理闻名。
※ jemalloc_pprof
负责将 jemalloc 的内存剖析数据转换成标准的 pprof 格式。
※ pprof
用于 CPU 性能分析,可以生成 pprof 格式的 Profile 文件。
三、 全局配置:启动Profiling开关
接下来,在 main.rs 中进行全局配置,指定 Jemalloc 的 Profiling 参数,并将其设置为默认的全局内存分配器。
// 配置 Jemalloc 内存分析参数 #[export_name = "malloc_conf"] pub static malloc_conf: &[u8] = b"prof:true,prof_active:true,lg_prof_sample:16\0"; #[cfg(not(target_env = "msvc"))] use tikv_jemallocator::Jemalloc; // 将 Jemalloc 设置为全局内存分配器 #[cfg(not(target_env = "msvc"))] #[global_allocator] static GLOBAL: Jemalloc = Jemalloc;
这段配置中的 lg_prof_sample:16 是一个关键参数。
它表示 jemalloc 会对大约每 2^16 字节(即 64KB)的内存分配进行一次采样。这个值越大,采样频率越低,内存开销越小,但精度也越低;反之则精度越高,开销越大。在生产环境中,我们需要根据实际情况进行权衡。
四、实现Profile生成函数:打造你的“数据采集器”
我们将 Profile 文件的生成逻辑封装成异步函数,这样就可以在服务的任意时刻按需调用,非常灵活。
内存Profile生成函数
#[cfg(not(target_env = "msvc"))] async fn dump_memory_profile() -> Result<String, String> { // 获取 jemalloc 的 profiling 控制器 let prof_ctl = jemalloc_pprof::PROF_CTL.as_ref() .ok_or_else(|| "Profiling controller not available".to_string())?; let mut prof_ctl = prof_ctl.lock().await; // 检查 profiling 是否已激活 if !prof_ctl.activated() { return Err("Jemalloc profiling is not activated".to_string()); } // 调用 dump_pprof() 方法生成 pprof 数据 let pprof_data = prof_ctl.dump_pprof() .map_err(|e| format!("Failed to dump pprof: {}", e))?; // 使用时间戳生成唯一文件名 let timestamp = chrono::Utc::now().format("%Y%m%d_%H%M%S"); let filename = format!("memory_profile_{}.pb", timestamp); // 将 pprof 数据写入本地文件 std::fs::write(&filename, pprof_data) .map_err(|e| format!("Failed to write profile file: {}", e))?; info!("Memory profile dumped to: {}", filename); Ok(filename) }
CPU Profile生成函数
类似地,我们使用 pprof 库来实现 CPU Profile 的生成。
#[cfg(not(target_env = "msvc"))] async fn dump_cpu_profile() -> Result<String, String> { use pprof::ProfilerGuard; use pprof::protos::Message; info!("Starting CPU profiling for 60 seconds..."); // 创建 CPU profiler,设置采样频率为 100 Hz let guard = ProfilerGuard::new(100).map_err(|e| format!("Failed to create profiler: {}", e))?; // 持续采样 60 秒 tokio::time::sleep(std::time::Duration::from_secs(60)).await; // 生成报告 let report = guard.report().build().map_err(|e| format!("Failed to build report: {}", e))?; // 使用时间戳生成文件名 let timestamp = chrono::Utc::now().format("%Y%m%d_%H%M%S"); let filename = format!("cpu_profile_{}.pb", timestamp); // 创建文件并写入 pprof 数据 let mut file = std::fs::File::create(&filename) .map_err(|e| format!("Failed to create file: {}", e))?; report.pprof() .map_err(|e| format!("Failed to convert to pprof: {}", e))? .write_to_writer(&mut file) .map_err(|e| format!("Failed to write profile: {}", e))?; info!("CPU profile dumped to: {}", filename); Ok(filename) }
- ProfilerGuard::new() 100 Hz 意味着每秒钟会随机中断程序 100 次,以记录当前正在执行的函数调用栈
- tokio::time::sleep(std::time::Duration::from_secs(60)).await 表示 pprof 将会持续采样 60 秒钟
- guard.report().build() 这个方法用于将收集到的所有采样数据进行处理和聚合,最终生成一个 Report 对象。这个 Report 对象包含了所有调用栈的统计信息,但还没有转换成特定的文件格式
- report.pprof() 这是 Report 对象的一个方法,用于将报告数据转换成 pprof 格式
五、 触发和使用 Profiling:随时随地捕捉性能数据
有了上述函数,我们实现了两种灵活的触发方式。
※ 定时自动生成
通过异步定时任务,每隔一段时间自动调用 dump_memory_profile() 和 dump_cpu_profile() 。
fn start_profilers() { // Memory profiler tokio::spawn(async { let mut interval = tokio::time::interval(std::time::Duration::from_secs(300)); loop { interval.tick().await; #[cfg(not(target_env = "msvc"))] { info!("Starting memory profiler..."); match dump_memory_profile().await { Ok(profile_path) => info!("Memory profile dumped successfully: {}", profile_path), Err(e) => info!("Failed to dump memory profile: {}", e), } } } }); // 同理可以实现CPU profiler }
※ 手动 HTTP 触发
通过提供 /profile/memory 和 /profile/cpu 两个 HTTP 接口,可以随时按需触发 Profile 文件的生成。
async fn trigger_memory_profile() -> Result<impl warp::Reply, std::convert::Infallible> { #[cfg(not(target_env = "msvc"))] { info!("HTTP triggered memory profile dump..."); match dump_memory_profile().await { Ok(profile_path) => Ok(warp::reply::with_status( format!("Memory profile dumped successfully: {}", profile_path), warp::http::StatusCode::OK, )), Err(e) => Ok(warp::reply::with_status( format!("Failed to dump memory profile: {}", e), warp::http::StatusCode::INTERNAL_SERVER_ERROR, )), } } } //同理也可实现trigger_cpu_profile()函数
fn profile_routes() -> impl Filter<Extract = impl Reply, Error = warp::Rejection> + Clone { let memory_profile = warp::post() .and(warp::path("profile")) .and(warp::path("memory")) .and(warp::path::end()) .and_then(trigger_memory_profile); let cpu_profile = warp::post() .and(warp::path("profile")) .and(warp::path("cpu")) .and(warp::path::end()) .and_then(trigger_cpu_profile); memory_profile.or(cpu_profile) }
现在,我们就可以通过 curl 命令,随时在生产环境中采集性能数据了:
curl -X POST http://localhost:8080/profile/memory curl -X POST http://localhost:8080/profile/cpu
生成的 .pb 文件,我们就可以通过 go tool pprof 工具,启动一个交互式 Web UI,在浏览器中直观查看调用图、火焰图等。
go tool pprof -http=localhost:8080 ./target/debug/otel-storage ./otel_storage_cpu_profile_20250806_032509.pb
六、性能剖析:火焰图下的“真相”
通过 go tool pprof 启动的 Web UI,我们可以看到程序的火焰图。
如何阅读火焰图
※ 顶部: 代表程序的根函数。
※ 向下延伸; 子函数调用关系。
※ 火焰条的宽度: 代表该函数在 CPU 上消耗的时间。宽度越宽,消耗的时间越多,越可能存在性能瓶颈。

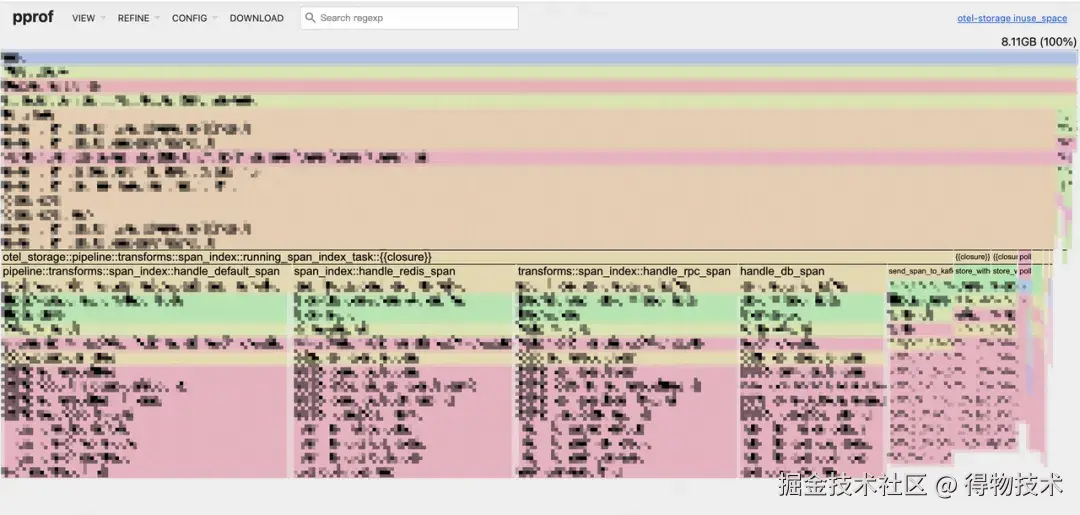
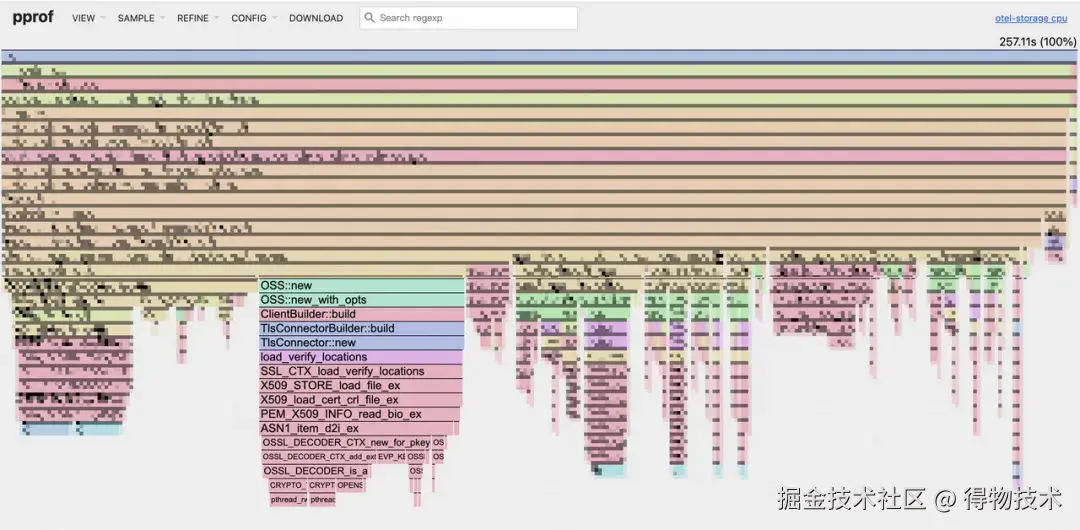
CPU Profile

Memory Profile
在我们的 CPU 火焰图中,一个令人意外的瓶颈浮出水面:OSS::new 占用了约 19.1% 的 CPU 时间。深入分析后发现, OSS::new 内部的 TlsConnector 在每次新建连接时都会进行 TLS 握手,这是导致 CPU 占用过高的根本原因。
原来,我们的代码在每次写入 OSS 时,都会新建一个 OSS 实例,随之而来的是一个全新的 HTTP 客户端和一次耗时的 TLS 握手。尽管 oss-rust-sdk 内部有连接池机制,但由于我们每次都创建了新实例,这个连接池根本无法发挥作用!
七、优化方案:从“每次新建”到“共享复用”
问题的核心在于重复创建 OSS 实例。我们的优化思路非常清晰:复用 OSS 客户端实例,避免不必要的 TLS 握手开销。
优化前
每次写入都新建 OSS 客户端。
fn write_oss() { // 每次写入都新建一个OSS实例 let oss_instance = create_oss_client(oss_config.clone()); tokio::spawn(async move { // 获取写入偏移量、文件名 // 构造OSS写入所需资源和头信息 // 写入OSS let result = oss_instance .append_object(data, file_name, headers, resources) .await; } fn create_oss_client(config: OssWriteConfig) -> OSS { OSS::new( …… ) }
这种方案在流量较小时可能问题不大,但在万亿流量的生产环境中,频繁的实例创建会造成巨大的性能浪费。
优化前
※ 共享实例
让每个处理任务( DecodeTask )持有 Arc 共享智能指针,确保所有写入操作都使用同一个 OSS 实例。
let oss_client = Arc::new(create_oss_client(oss_config.clone())); let oss_instance = self.oss_client.clone(); // ... let result = oss_instance .append_object(data, file_name, headers, resources) .await;
※ 自动重建机制
为了应对连接失效或网络问题,我们引入了自动重建机制。当写入次数达到阈值或发生写入失败时,我们会自动创建一个新的 OSS 实例来替换旧实例,从而保证服务的健壮性。
// 使用原子操作确保多线程环境下的计数安全 let write_count = self.oss_write_count.load(std::sync::atomic::Ordering::SeqCst); let failure_count = self.oss_failure_count.load(std::sync::atomic::Ordering::SeqCst); // 检查是否需要重建实例... fn recreate_oss_client(&mut self) { let new_oss_client = Arc::new(create_oss_client(self.oss_config.clone())); self.oss_client = new_oss_client; self.oss_write_count.store(0, std::sync::atomic::Ordering::SeqCst); self.oss_failure_count.store(0, std::sync::atomic::Ordering::SeqCst); // 记录OSS客户端重建次数指标 OSS_CLIENT_RECREATE_COUNT .with_label_values(&[]) .inc(); info!("OSS client recreated"); }
八、优化效果:性能数据“一飞冲天”
优化后的服务上线后,我们观察到了显著的性能提升。
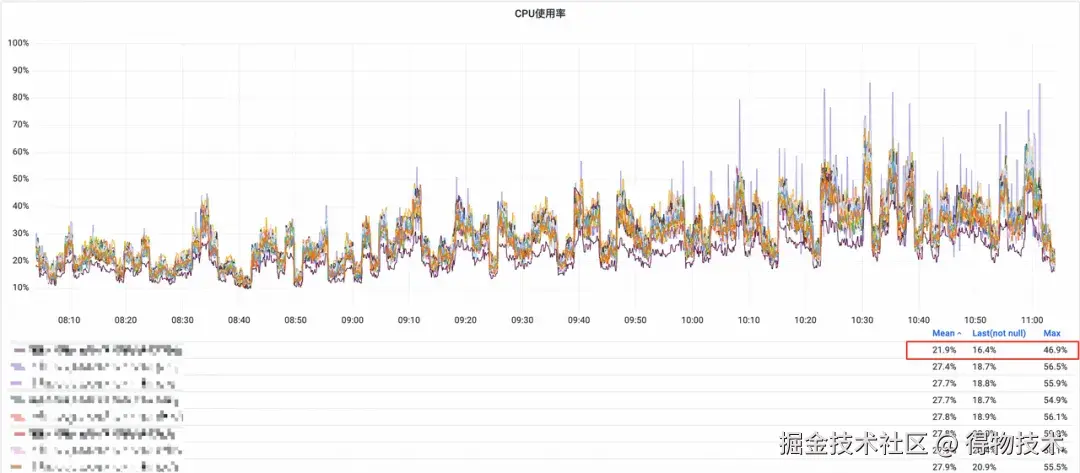
CPU 资源使用率
同比下降约 20% 。
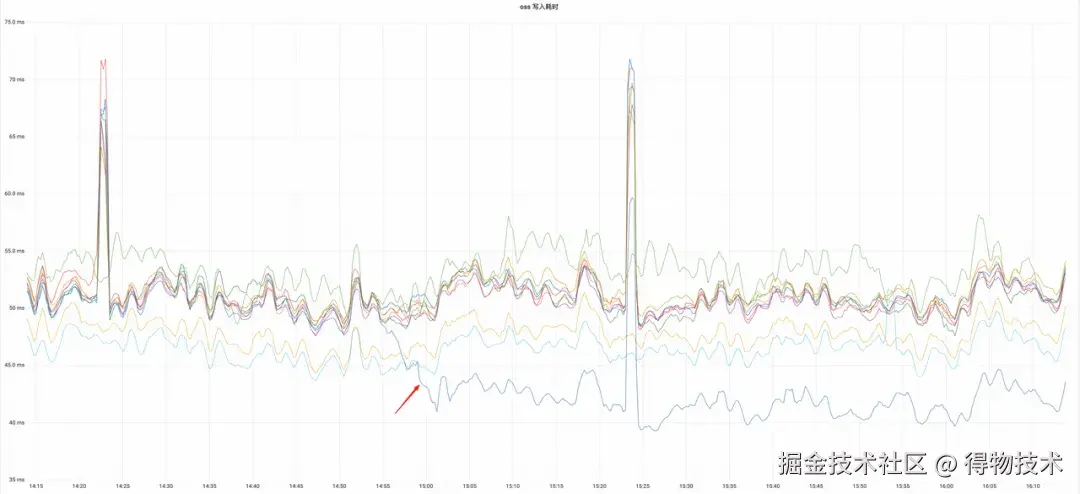
OSS 写入耗时
同比下降约 17.2% ,成为集群中最短的写入耗时。
※ OSS写入耗时
※ OSS相关资源只占千分之一
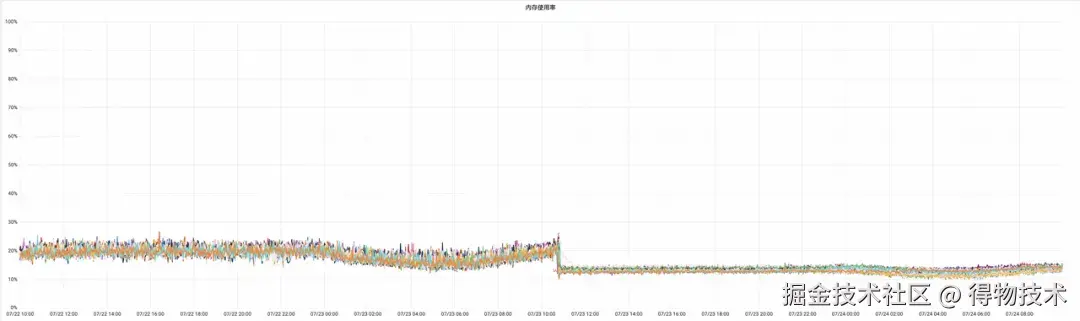
内存使用率
平均下降 8.77% ,这部分下降可能也得益于我们将内存分配器从 mimalloc 替换为 jemalloc 的综合效果。
这次优化不仅解决了特定服务的性能问题,更重要的是,它验证了在 Rust 中通过 Profiling 工具进行深度性能分析的可行性。即使在已经实现了初步性能提升的 Rust 服务中,仍然存在巨大的优化空间。
未来,我们将继续探索更高效的 Profiling 方案,并深入挖掘其他潜在的性能瓶颈,以在万亿流量的生产环境中实现极致的性能和资源利用率。

电商企业物流数字化转型必备!快递鸟 API 接口,72 小时快速完成物流系统集成。全流程实战1V1指导,营造开放的API技术生态圈。
更多推荐


 25
25 0
0- 0


 已为社区贡献3条内容

所有评论(0)